Calculating Rice Syrup Cost per Ton of Solids
For a rice syrup factory, cost control is not only about the price of rice, steam, or enzyme drums. The number that matters commercially is cost per ton of saleable dry solids.
That figure connects raw material use, conversion yield, Brix, filtration behavior, evaporation load, downtime, and rework into one practical plant-floor metric. It is also the right way to compare enzyme programs, because the lowest invoice cost does not always produce the lowest production cost.
Enzymesvalue supports rice syrup plants with enzyme solutions built for stable starch liquefaction, saccharification control, viscosity reduction, and predictable syrup output.
The core formula
Use this baseline calculation:
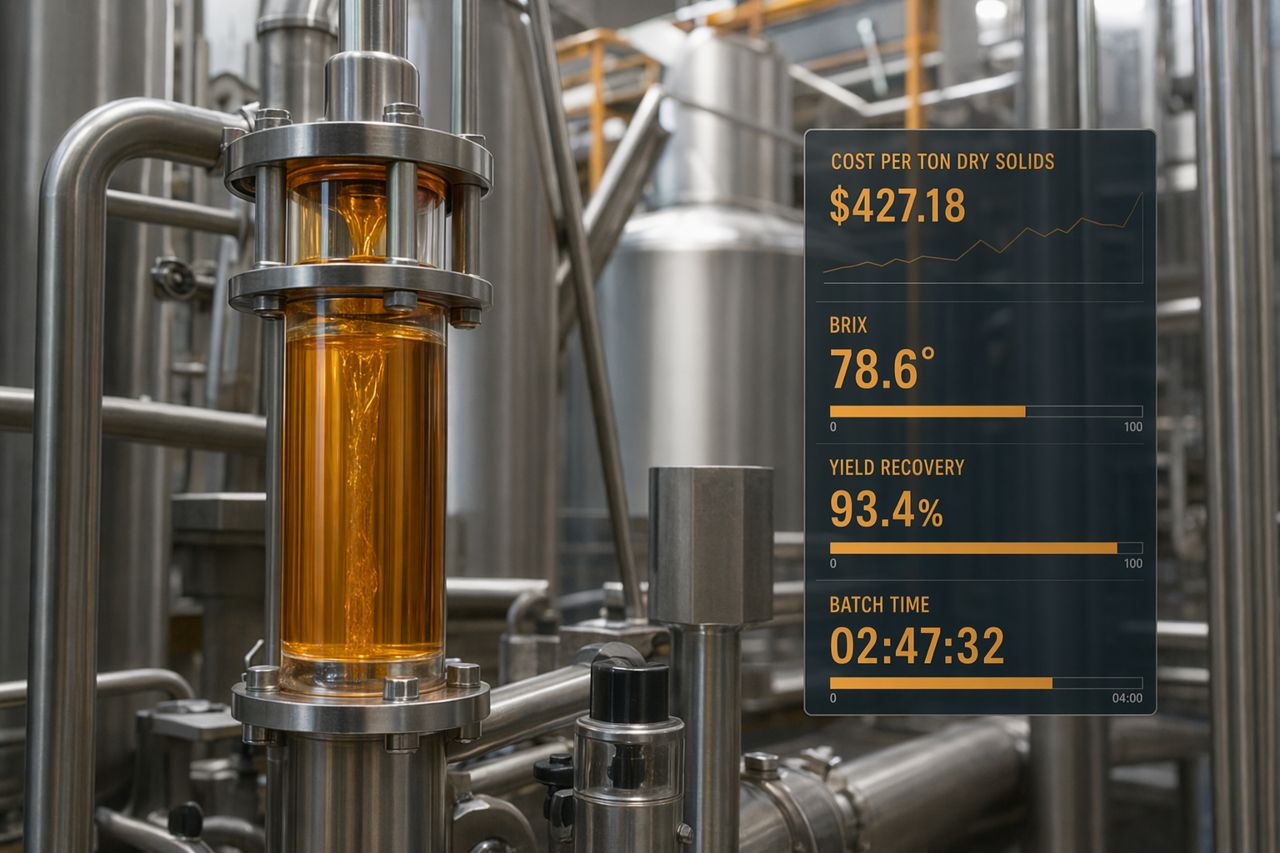
Cost per ton of dry solids = total production cost for the batch ÷ tons of saleable dry solids produced
Where:
Saleable dry solids = finished syrup mass × Brix percentage
Example structure:
- Finished syrup shipped: 100 tons
- Finished syrup concentration: 80 Brix
- Saleable dry solids: 80 tons
- Total batch cost: raw rice, utilities, chemicals, enzymes, labor, filtration, downtime, maintenance, waste handling, packaging, and quality losses
- Cost per ton of dry solids: total batch cost ÷ 80
This calculation becomes more useful when tracked batch by batch, not only at month end.
What belongs in total production cost?
A practical rice syrup cost model should include direct and hidden costs.
1. Raw rice and starch availability
Rice price is usually the largest visible cost, but starch availability is the real driver. Broken rice, milled rice, and off-spec streams can behave differently in cooking, slurry formation, liquefaction, and filtration.
Track:
- Rice input per batch
- Moisture variation
- Starch availability
- Insoluble residue
- Protein and fiber impact on filtration
- Variability between suppliers or lots
If the plant buys cheaper rice but loses conversion efficiency or filtration stability, the cost per ton of solids may rise.
2. Liquefaction performance
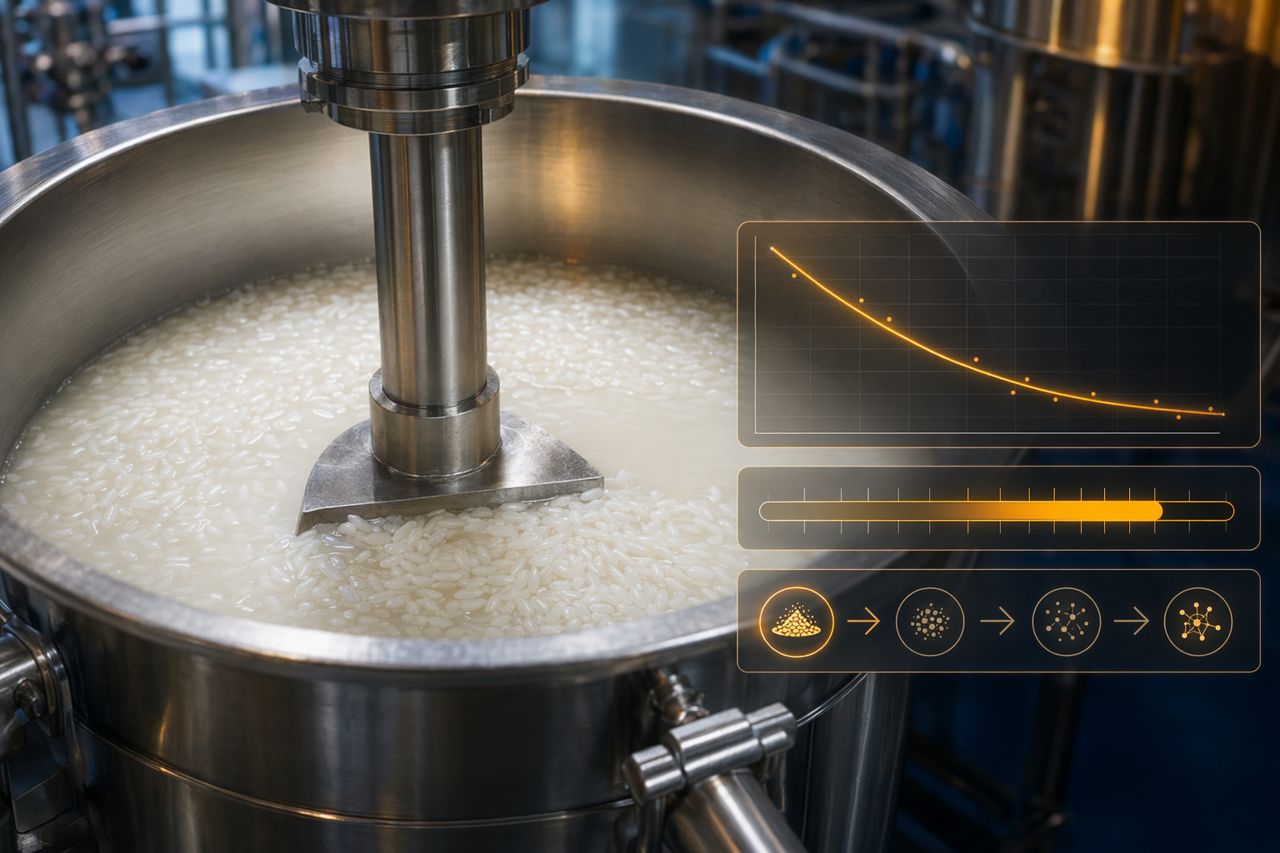
Liquefaction sets up the entire process. Poor starch breakdown creates high viscosity, uneven flow, longer holding times, and more difficult filtration.
Watch for:
- Slurry viscosity at transfer points
- Pump load and circulation behavior
- Jet cooker or cook tank stability
- Iodine reaction trend, where used by the plant
- Starch fragments passing forward into saccharification
- Increased strain on filters and evaporators
A dependable liquefaction enzyme program helps keep the batch moving. For plant managers, that means fewer slow transfers, fewer blocked lines, and less operator intervention.
3. Saccharification and target syrup profile
Rice syrup is not one product. Maltose syrup, glucose-rich syrup, high-solids syrup, and specialty profiles all place different demands on the enzyme system.
The important cost question is not only whether the syrup reaches target DE or sugar profile. It is how consistently it gets there within the planned time window.
Inconsistent saccharification can increase cost through:
- Extended holding time
- Rework or blending
- Off-spec batches
- Unstable sweetness profile
- Higher microbial risk during long process windows
- Scheduling disruption
Enzymesvalue helps plants select enzyme combinations for the target product, including liquefaction, saccharification, and debranching support where appropriate.
4. Filtration behavior
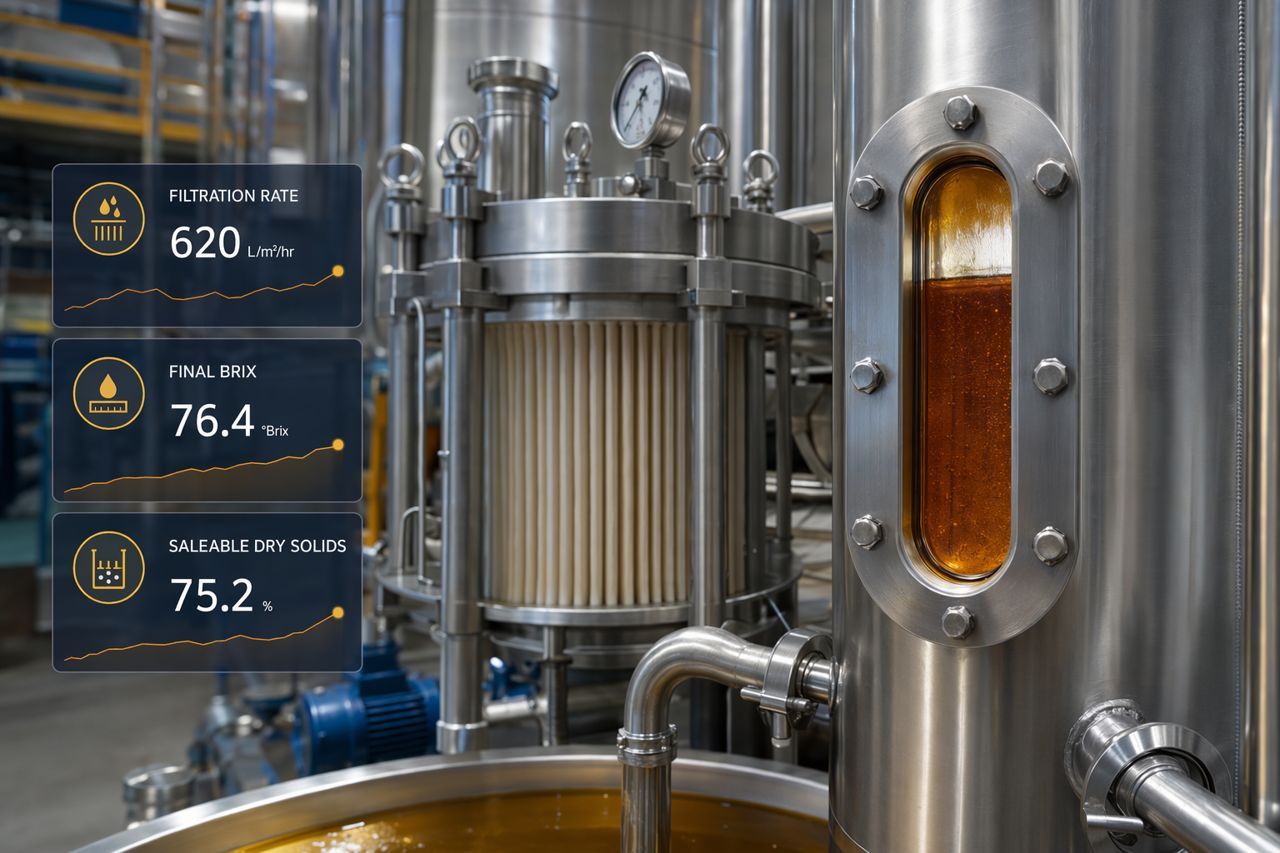
Filtration cost is often underestimated. A syrup that converts well on paper can still be expensive if it blinds filters, slows flow, or requires excessive filter aid.
Include:
- Filter cycle time
- Filter aid consumption
- Carbon treatment losses
- Press or membrane cleaning frequency
- Solids captured in cake
- Syrup losses during cake discharge
- Operator time and maintenance events
Better enzyme-driven viscosity control can improve downstream separation. That can reduce total batch cost even when enzyme spend is not the smallest line item.
5. Evaporation load and energy
Water removed in the evaporator costs steam, electricity, cooling capacity, and time. If upstream conversion or filtration slows the process, evaporator scheduling becomes less efficient.
Track:
- Feed solids into evaporation
- Evaporation time per batch
- Steam use
- Fouling and cleaning frequency
- Syrup color development during extended heating
- Final Brix stability
Stable conversion and cleaner feed help the evaporator do its job with fewer surprises.
6. Downtime and cleaning losses
Downtime rarely appears on an enzyme comparison sheet, but it can dominate the true cost per ton.
Account for:
- Unplanned tank holds
- Pipe blockages
- Filter cleaning delays
- Evaporator fouling
- Product dumped or downgraded
- Extra CIP cycles
- Overtime caused by slow batches
If an enzyme program reduces stoppages and shortens recovery time, its value should be measured in the full production model.
Enzyme cost should be measured against delivered solids
A common mistake is to compare enzyme programs only by purchase price. For rice syrup production, the better comparison is:
Enzyme cost per ton of saleable dry solids
Then compare that number alongside:
- Yield recovery
- Batch time
- Filtration rate
- Final Brix consistency
- Off-spec frequency
- Rework volume
- Cleaning frequency
- Technical support responsiveness
The right enzyme supplier for rice syrup production should help reduce total cost, not simply offer a low-cost drum.
A practical worksheet for plant teams
Use the following fields for every representative batch:
Batch inputs
- Rice lot and supplier
- Rice mass charged
- Moisture estimate
- Water addition
- Enzyme program used
- Process temperature profile
- Batch start and finish time
Conversion indicators
- Liquefaction behavior
- Viscosity observations
- Saccharification time
- Target syrup profile
- Final DE or internal specification result
- Deviations from standard process conditions
Separation and finishing
- Filtration time
- Filter aid or carbon use
- Cake loss estimate
- Evaporation time
- Final syrup Brix
- Color and clarity result
Cost inputs
- Rice cost
- Enzyme cost
- Utilities
- Labor
- Consumables
- Waste handling
- Maintenance or downtime impact
- Quality losses or downgraded product
Output
- Finished syrup mass
- Finished Brix
- Saleable dry solids
- Total production cost
- Cost per ton of dry solids
When this worksheet is repeated across multiple batches, patterns become visible. A plant can see whether cost spikes are linked to raw rice variation, filtration instability, enzyme fit, evaporation load, or operating discipline.
Where Enzymesvalue adds value
Enzymesvalue supplies enzyme solutions for rice syrup production with a focus on plant practicality: stable liquefaction, controlled saccharification, manageable viscosity, and dependable technical support.
Our work with rice syrup factories typically focuses on:
- Matching enzyme selection to the target syrup profile
- Improving batch-to-batch consistency
- Reducing high-viscosity transfer problems
- Supporting better filtration behavior
- Helping protect yield during raw material variation
- Reducing rework caused by incomplete or uneven conversion
- Providing technical guidance when process conditions change
The commercial goal is simple: more saleable dry solids from the same production assets, with fewer interruptions.
Key takeaway
Cost per ton of solids is the clearest way to evaluate rice syrup production economics. It connects the factory floor with the sales ledger.
If your plant is only reviewing enzyme price, you may be missing larger savings in yield, filtration, energy, downtime, and off-spec reduction.
Request a quote
Planning a new rice syrup line, reviewing enzyme cost, or troubleshooting yield and filtration issues? Contact Enzymesvalue through the on-site request a quote form. Share your syrup target, rice input, process outline, and current bottleneck, and our technical team will recommend a practical enzyme approach for your factory.